Formatting and Styling
Text
Label's content can be controlled by changing the text option's value. Labels can be displayed on multiple lines by using the newline character (\n) between each line.
Tip: the space between each line can be adjusted using the
font.lineHeightoption.
Following scopes will be replaced automatically:
%l: will be replaced byLabelof the data%p: will be replaced byPercentof the data%v: will be replaced byValueof the data\n: will be replaced byNew Line
Example:
outlabels: {
    text: '%l PER => %p \n VAL => %v'
}
Result:

Text Alignment
The textAlign option only applies to multiline labels and specifies the text alignment being used when drawing the label text (see CanvasRenderingContext2D.textAlign). Note that right-to-left text detection based on the current locale is not currently implemented.
Supported values for textAlign:
start(default): the text is left-alignedcenter: the text is centeredend: the text is right-alignedleft: alias ofstartright: alias ofright
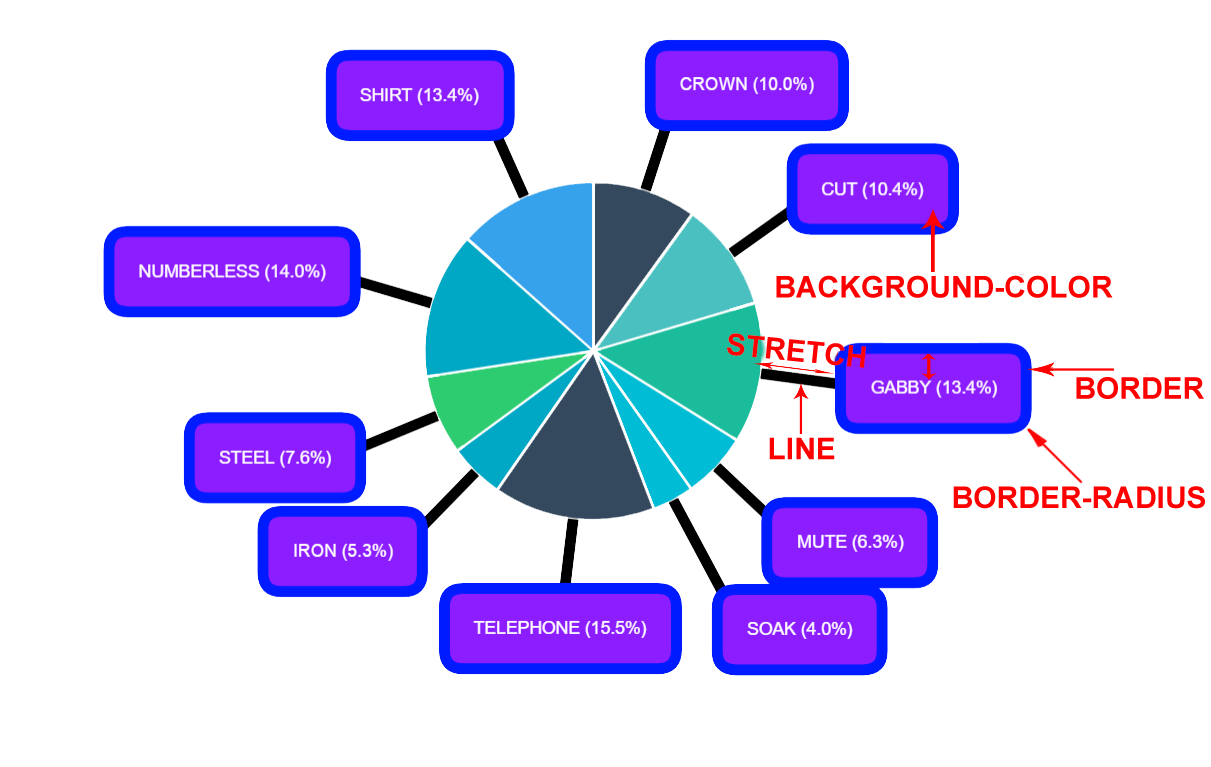
Graph Styling
There are plenty of options available for Label's styling
Example:
outlabels: {
    backgroundColor: "#8C1DFF", // Background color of Label
    borderColor: "#001BFF", // Border color of Label
    borderRadius: 17, // Border radius of Label
    borderWidth: 10, // Thickness of border
    color: 'white', // Font color
    display: true,
    lineWidth: 10, // Thickness of line between chart arc and Label
    padding: 17,
    stretch: 100, // The length between chart arc and Label
    text: "%l (%p)"
    textAlign: "center"
}